Insights Dashboard
Find Out Which Parts of Your Organisation Use the App Most... And Least

It's a good idea to keep an eye on which areas of your business are using your app most, and which might need some extra attention in terms of app promotion or finding out what problems the app could potentially solve for them, which would make it something they want to use.
This quick breakdown of user group app usage can be found on the Users Tab of the Insights Dashboard.
In the Users Tab, you'll see the familiar drop-down menus to select time periods for comparison and you can limit your query to specific user groups should you wish. For a quick overview of app usage by user group, you could select Lifetime on both sides of the comparison, however for this example we're going to select the last three months and compare that with the previous three months to see if there has been any change in behaviour among our user groups. This can be particularly useful if you have recently added new features or content based on feedback from a specific area of the business, to see if those additions have made a difference to whether those in that area of the business are using the app.
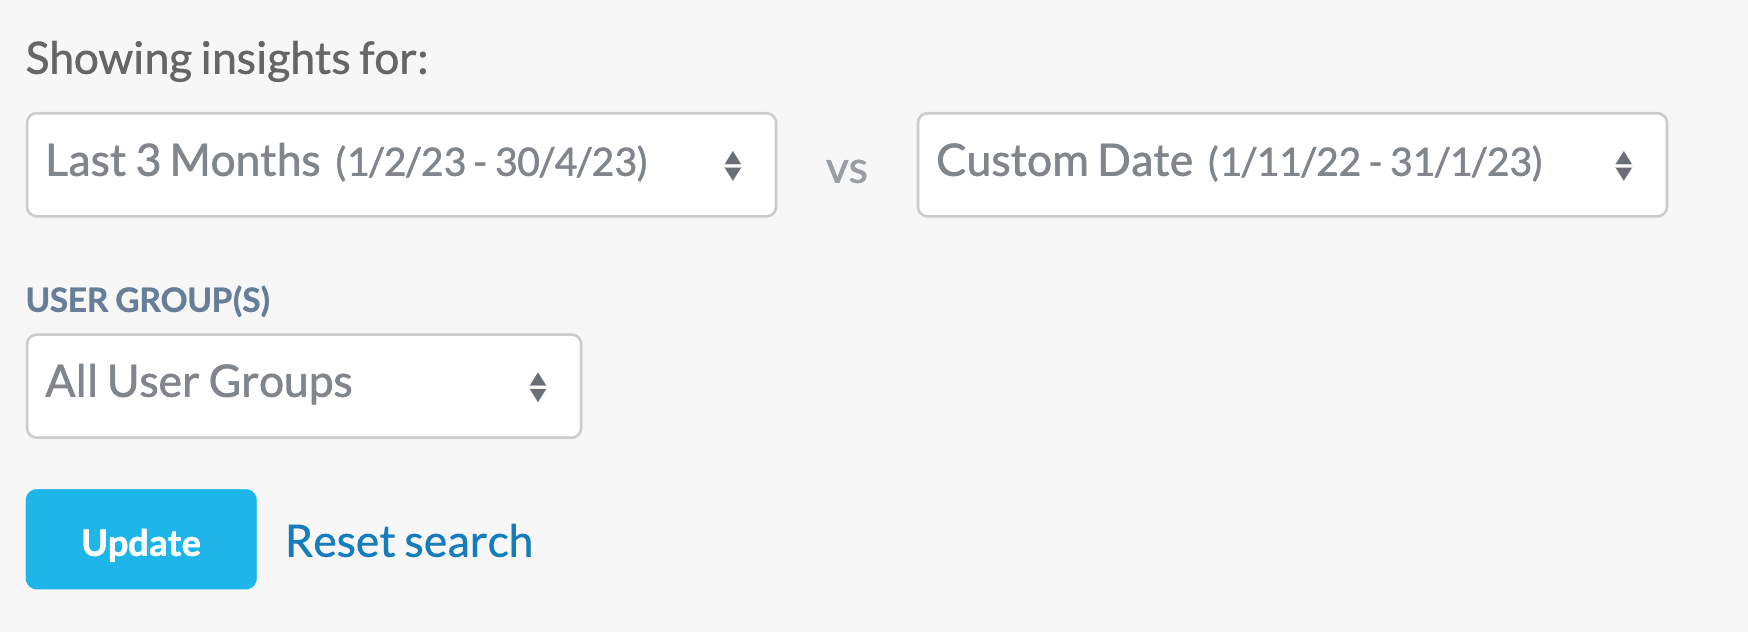
Choosing 'Last 3 Months' here gives us February, March and April, so we can then use the Custom Date option for the comparison time period to choose November, December and January. As a reminder, you do this by simply clicking on the 1st November, then using the arrows at the top to change months, then click again on the date to end with which in this case is the 31st January.
After pressing Update to run the query, the first thing you'll see on the Content tab is the breakdown of Registrations and Logins by individual users, just like we also saw on the Overview Tab. If you scroll down though, you'll see the User Groups Login Overview section of the Users tab, which is what we'll use to understand which areas of the business are using the app most and least.
While you can get a sense of this on the Overview and Content tabs, this User Groups Login Overview on the Users Tab is a better way to do so, because it gives you a percentage for each group, of how many users from that group have used the app in the selected time period. Because it gives you the percentage here, it's much clearer.
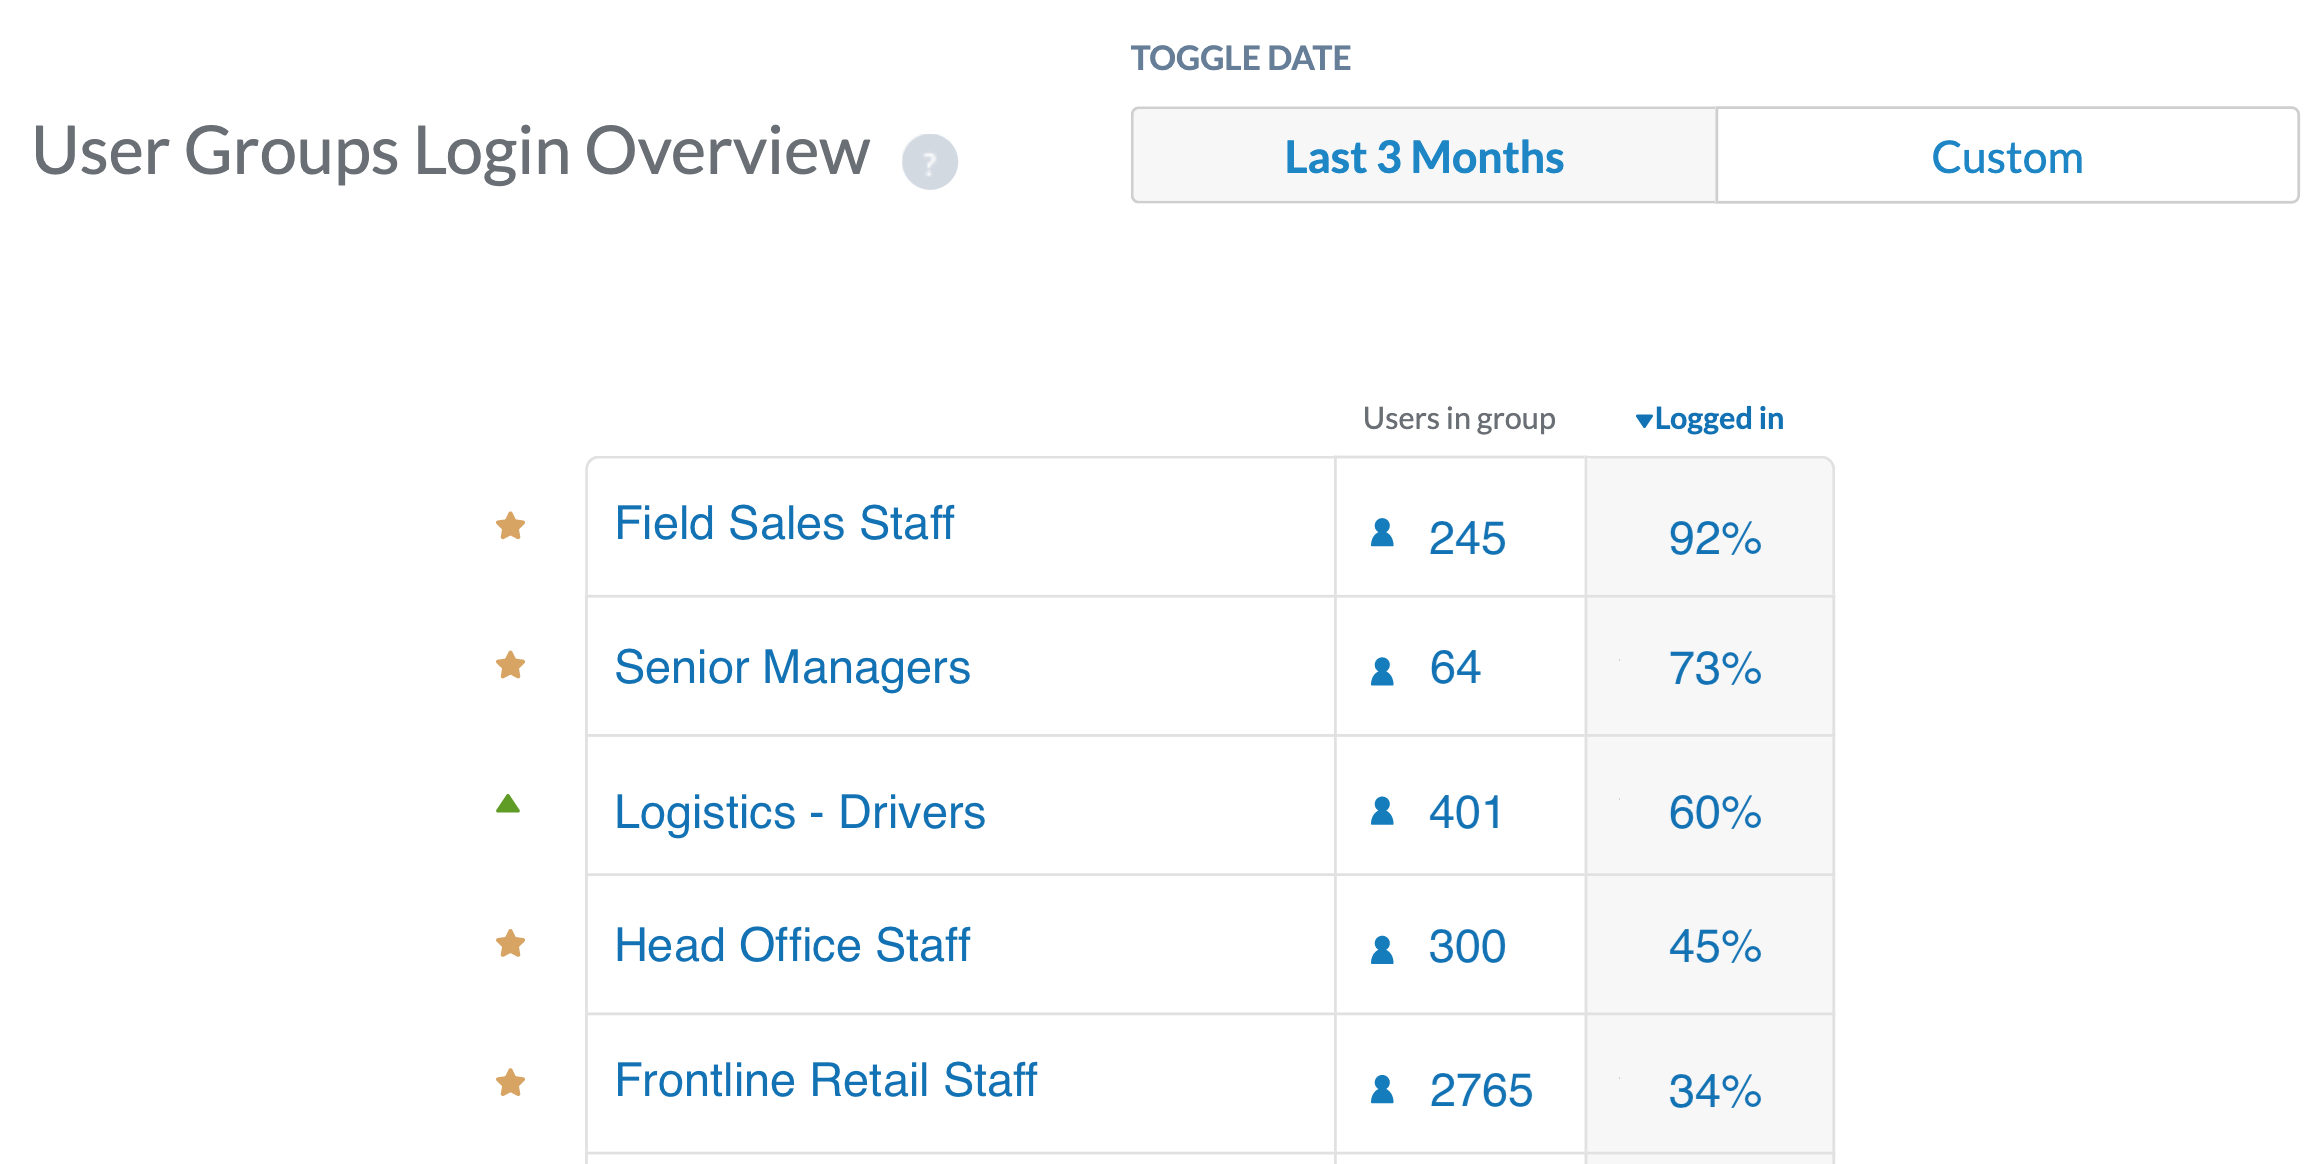
Note that the example above is illustrative only. You're likely to have to press the Load All button to see the full list of your user groups, and the example here is using an organisation which has only these five groups. Nonetheless, you'll see a list of your user groups along with the number of users in each group and the percentage of that group that have used the app in the selected time period. If you have chosen a different time period for comparison, you can use the Toggle Date buttons to switch between your two time periods and see how the list has changed over time.
In our example above, 92% of the Field Sales Staff group have used the app in the last three months, while only 34% of the Frontline Retail Staff have done so. For each of these stats, you'll want to understand why this is the case. Are the Field Sales Staff using the app because it contains content or functionality that genuinely helps them or makes their jobs easier? If so, can you make some time for focus groups or questionnaires with the Frontline Staff to find out what kind of content or functionality would make them want to use it?
Only 45% of our Head Office Staff are using the app. Given that they work at Head Office, they're all desk-based employees so have they been made aware that there's also a desktop webapp version of the app available? Can you do more to promote that option to them so they can access it from desktop if they don't want to download? Could you perhaps talk to your IT team about setting all of the browser homepages to the URL for your webapp? Or even using the desktop screensavers to promote your app?
Understanding the usage across your various user groups in different areas of your business is essential to making positive changes to your app, to ensure that you're giving your employees reasons to use it. So that's it's must-have and not just nice-to-have.
For some ideas and examples of what our other customers have done to address this, please have a look at the Customer Success Tips section on our blog at https://blog.thrive.app and the Thrive Spotlight (What's New) in the Thrive CMS!